
“The fact that the vast majority of OECD countries continued to go downwards – I would not have predicted that.”
In this episode, we speak again to John Jerrim. He is Professor of Education and Social Statistics and Director of the Quantitative Social Science Research Centre at UCL Institute of Education. Last year, John was Chalk & Change’s first interviewee, discussing his special subject: international tests and what we can and can’t learn from them. By request, he returned to discuss the results of the 2025 PISA tests which were released in early September. We discussed what had surprised him, what trends are emerging, and how robust these results are.
We discussed:
- What difference it makes asking whether a student has “skipped” or has “missed” school
- How well his predictions for PISA 2025 had held up
- How valid English PISA results are
- What the government should be doing to validate the data – and isn’t
- The role AI is playing in his work
It’s early days in understanding the results: “the bomb has hit,” as John put it, and now it’s up to people like him to interrogate the data and find out what it really shows. But having made predictions last time we spoke, this proved a great opportunity to revisit them and try to make sense of England’s recent successes.
You can listen to the episode on Spotify and Apple Podcasts, or read the transcript, below.
Before you dive in – if you help teachers get better, whether as a coach, a professional development lead or a school leader, I’ve written a book for you. Improving Teaching distils fifteen years of training teachers, supporting leaders and research into concrete steps you can apply straight away. It’s available now.
When we spoke last, Google Scholar had you on 247 papers. A year and a quarter later, you’re up to 278. In the intervening period, which of those papers has been particularly interesting? And how far is AI making you more productive at generating academic research papers?
That’s two really good questions. I can’t even think about what papers I’ve written. On the first one: a really interesting one using PISA data. We looked at the apparent change in kids skipping school over time since the pandemic. There’s an interesting/nerdy methodological thing in there. In a few countries, they changed the word in one round from ‘skip’ school’ to ‘miss’ school. We know skipping school is very different to missing school. What you see very clearly in that data, which wasn’t really documented anywhere – it took real detective work – was that it had a big impact on the results, to the point that some people did some analysis and got it completely wrong, including some of the OECD, because they hadn’t spotted it. We ended up using large language models to say, “ChatGPT, do you notice there’s any problem here?” and it couldn’t find the problem. In fact, it fed us back the usual bullshit and said everything’s fine.
In terms of AI more generally, it’s really interesting because over the fast few years, everyone’s started to realise “What can I use it for?” I’ve found it useful for checking stuff: “Does this make sense? What edits would you make here?” Then I go back and think, shall I make that edit? Some people I know are using it to do coding with Codex and Claude. I’m not quite there yet because I don’t have the trust to farm it out. When I have seen it done, stuff that would take me 10–20 lines of code, it comes back with five or six pages. But it’s definitely made me more productive and more accurate. I think people are underestimating how useful it is for that purpose.
The capacity it has to proofread something with a degree of patience and attention that no human can achieve: like you, I’ve been using it to get feedback on writing, and my writing has dramatically improved because it can say, “That turn of phrase is a bit hackneyed.” I don’t have an editor who would do that for me.
Let’s dive in with the PISA report. At a high level, what struck you most?
What struck me most was that my predictions this time around were completely wrong. I very much predicted every country would bounce back. It’s what you would expect following the pandemic: that was a one-off big shock. The fact that the vast majority of OECD countries continued to go downwards – I would not have predicted that. At the same point, we obviously held up very well. I thought other countries would catch us back up more than they did, rather than fall away from us. This was one of the more surprising sets of results in general, because of the broad cross-country patterns that we saw.

We shouldn’t place too much store in country ranks. But it was also interesting: in 2023, we were top 10 of 81 countries or systems, and now we’re in the top 10 of 91 countries and systems – so, maintaining that as other countries slip away. The discrepancy grew between England and the other home nations, and Finland as well.

I went back to our previous conversation, and one of the points you made which stuck with me was that you were interested if you saw things move by 10 points or more, or if you saw a trend. You were generally not particularly interested if you only saw things once – you mentioned particular blips. How confident would you now be to say, “England is definitely doing better than all the other countries”?
Good question. That comes back to some of the nuances that we’re seeing with PISA, particularly this time around. I would feel most confident, to be honest, in maths. I say that because we’ve got multiple sources of evidence for that now.
- You’ve got the PISA results, where we now seem to be doing better than other countries.
- TIMSS we’ve also performed strongly in.
- The National Reference Test has some very positive findings, particularly at Grade 7 and the adjustment upwards there.
So if anywhere, it’s the maths results: you’ve got it pointing from multiple different sources. I think that’s particularly interesting and encouraging.
Where I’ve got the least confidence in the results this time around for England would be science, where we saw our results surprisingly go up. That goes back to what I said last time. It’s got that 10-point threshold that interests me, but it’s not sustained yet over time. If we see it again next time, I’d probably revise what I’m feeling about that – maybe. But for the moment, my hunch is that we’ll go back down in science next time around. Judging how well I predicted this time around, that may not be worth much.
Science is interesting because in TIMSS, in Year 5 and Year 9, we did see a significant jump – that was 2023. It’s quite hard to explain, because people are able to point at reading and say, “We’ve done phonics, we’ve done this.” They’re able to point to maths and say, “We’ve done maths hubs,” and so on. It’s fair to say we’ve not done loads in science, and yet this improvement appears. That would then suggest, with Year 9 in 2023, there is some kind of trend there. But I know the science assessment changed. I know you’re not a science assessment design person, but I wonder whether that had anything to do with it. I know other countries also did better in science than they did elsewhere, and I wonder whether that came into it at all.
It’s hard to say. I remember from the TIMSS 2023 science results – I’m scratching the back of my memory banks now – there were some strange findings as well. Wasn’t it completely clustered amongst boys or completely clustered amongst girls? [The average for girls improved from 515 to 524; for boys it rose from 515 to 538.] Which was really surprising. I still feel from those two, we don’t have enough there yet to have real confidence that it’s a real trend. But watch this space over the next couple of years to see what emerges there.
In terms of science generally being better than the other domains, there is some interesting stuff going on in terms of the PISA assessment design. It gets into the nuances about it changing over time. They brought in computer-adaptive testing this time around, which may have had some impact on test motivation, which could impact across the different subjects. A point that a lot of people have probably missed this time around – because it’s in Annex A of the OECD report – is the potential for test effort to be playing into this decline across countries. You end up seeing the OECD say, in some slightly weasel wording in places, that test effort, or student engagement, may well have declined, particularly on the reading test, which explains some of the falls there.
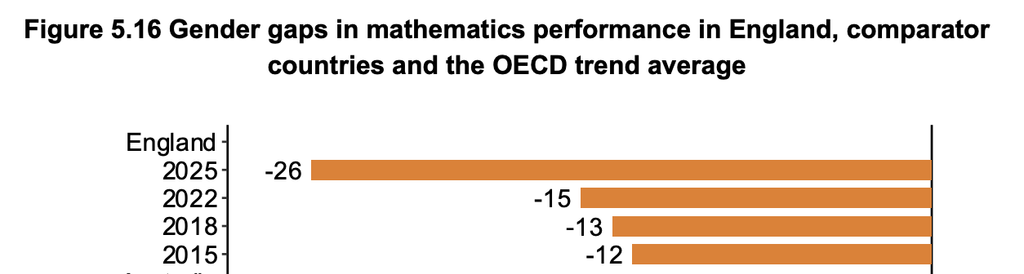
To pick up on this gender point, because it surprised me: if I look at the maths gender gap on PISA, in 2015 boys had a 12-point advantage. In 2025 it’s gone up to 26 points.
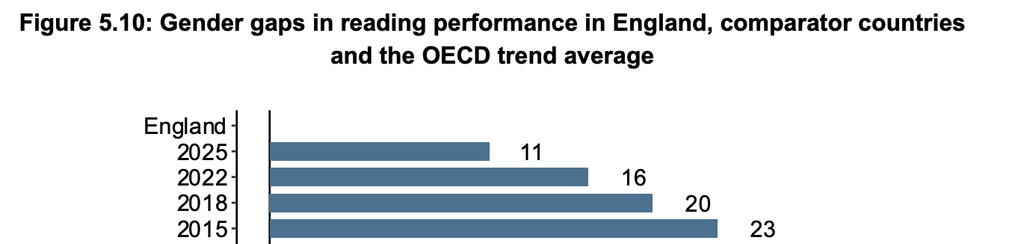
Whereas girls had an advantage in reading in 2015 of 23 points, and that’s fallen to 11 points.
If you look at the trends, England’s improvement or maintenance primarily comes from improved performance by boys. Do we have GCSE data that matches that? No one’s suggested that we might have solved boys’ education., at all I’m really curious: do we believe this is a thing?
The only evidence that I’ve looked at and produced myself, again using these international studies, which is consistent with it, is going back to this question about skipping school and truancy. Once we’d unpicked some of the data problems, as far as we could see, since the pandemic there has been an increase in truancy, particularly amongst girls and particularly within English-speaking countries, which would be consistent with increasing mental health issues amongst this group, but also potentially more disengagement in school amongst girls in particular.
I don’t think we have a good explanation for that pattern yet. It’s something that we need to dig into some more. It may well overlap with this test-motivation point that I’ve been talking about, and how that’s changed over time as well. We’re still in that stage with these PISA results where the bomb’s hit, and we’re still surveying the landscape around us. It’s over the next few months – frankly the next couple of years – that we’ll start unpicking what’s really been going on here. It’s never a quick, easy thing to do because, frankly, there are so many explanations for a lot of this stuff that we see and observe that you have to go through it and think about it quite methodologically.
Last question, then, on the distribution of results. One of the concerns that we always get is that overall performance has improved, but that’s been at the expense of children lower down the distribution who are struggling. My initial take was, well, in England, compared to other countries, you see more high performers and fewer low performers.
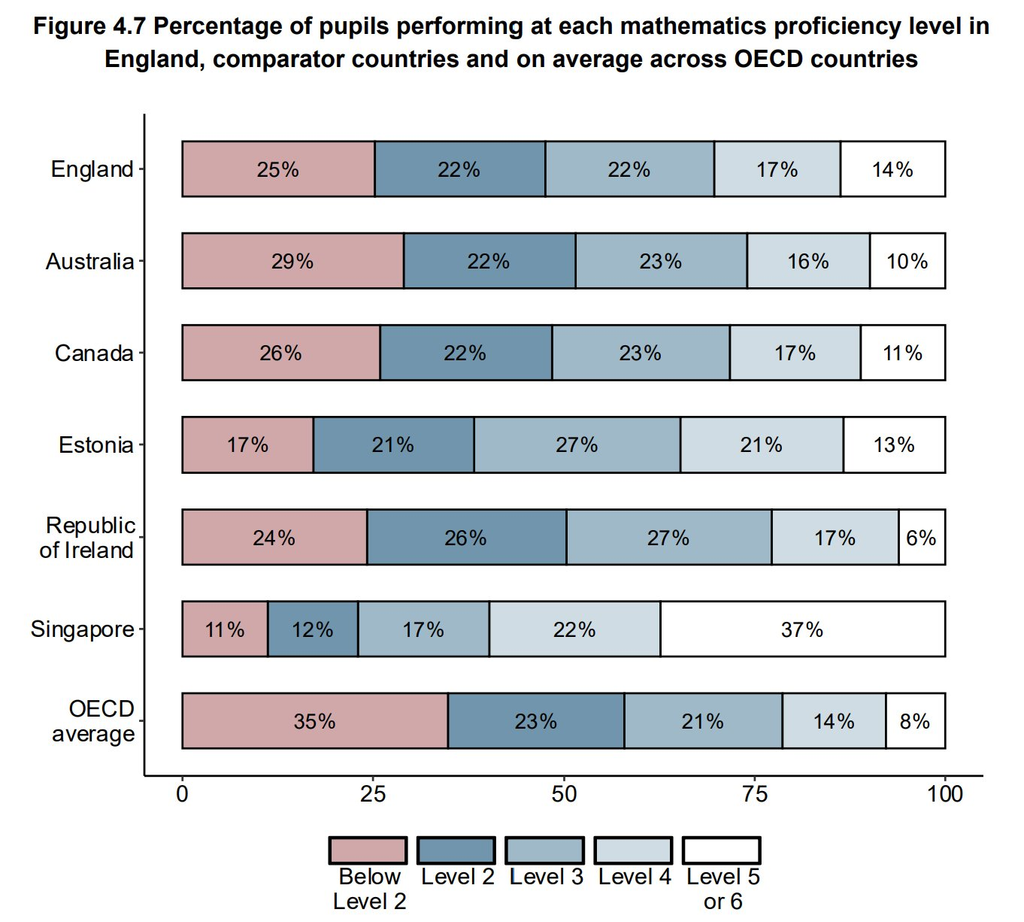
But I’m curious whether you think there are any grounds in that argument that we should be concerned about.
The first point is that if we take the data all at face value, where England has a particular strength, particularly compared to the rest of the UK countries, is our ability to stretch the top end of the distribution and those from more socio-economically advantaged backgrounds. If you compare England to Scotland and Wales in particular, we really pull away in terms of that 90th percentile. It seems we’ve got a real strength there. At the same time, compared to those countries, our disadvantaged pupils seem to be doing better. Our bottom tail seems to be generally doing better. It seems to be a good-news story there.
The one thing that’s worth flagging again, which always gets flagged and we don’t have complete evidence on yet, is how some of the PISA sampling exclusions play out in some of these comparisons. My guess is that they come out in the wash when we’re comparing England to the other UK countries. I don’t think we have definitive proof of that yet, and if it’s going to impact our results anywhere, it probably impacts the bottom tail of the distribution most, because who are the pupils that aren’t in school or get off-rolled? Who are those that are absent on the day of the test? Who are the ones that get excluded from the assessments because of special educational needs? It’s the lowest achievers, so there’s quite a lot of potential, when we look at the bottom end of the distribution, for our estimates to be particularly affected. The good news is, if we’ve got any chance of being able to work that out in any country, it’s probably England, because we do have some good other data that we can use to probe it. But that’s the one caveat that I’d put around us doing better at the bottom tail.
Historically, you’ve been really cautious about the claims made about the validity of international test results. We talked a bit about this last time we spoke, so I won’t go into all of it again. But I’m curious to know whether you think those non-response issues have got worse. I know exclusions are up and above the OECD thresholds, but that’s been given a pass. They’ve switched when the test happens from the autumn to February to May. Claude did me a back-of-the-envelope calculation. I said, “We’ve got Year 10s who know less, but the Year 11s who are involved know more.” Claude suggested it washes out to a month’s more learning on average, which is clearly made up, but there’s something interesting there. I’m curious what your thoughts are: whether things have got worse, or whether they’re roughly equivalent to previous rounds.
From what I’ve seen at the moment, we’re broadly similar to previous rounds. That would be my best guess, with the caveat that what you really need to do is know – these kids who’ve done the PISA test, what did they do in their GCSEs? The correlation there is obviously really strong. If you know how these kids that didn’t respond did in their GCSEs, you can get a really good handle on the bias, which is essentially how I’ve done it previously. They haven’t published that yet in the English report. I don’t think Wales and Scotland have published it this time around. I really think the governments should do that.
They do it for the National Reference Test, and the basis of that being comparable over time is that there’s an upward bias, but the upward bias stays the same. My hunch is that that’s probably true this time round, and you just think, UK governments: just go out and do it, because it then becomes really convincing. The exclusions are a classic case in point here. They do look a little bit high. I’m a bit worried about it. That could throw some of our results out. The data is there to go and really interrogate that and provide some good evidence to say, “We think this has happened; this is similar for this time around, or not.” There’s no reason not to do it, because it’s there and it’s important, so it should be done. But, like I said, if you asked me now, I’d say probably about the same in terms of the sampling exclusion stuff as last time.
You’ve said there’s no reason not to do it, and yet it is not being done. The data is there. I presume you’ve got access to the National Pupil Database. Is there something you could do? Is there something I could do if I had access to the NPD? Or do we just need to rely on the goodness of the Department for Education and the devolved administrations?
If they gave me or you or someone the data, they could go and do it. The issue is you’ve got to put in a request to, for instance, the Department for Education and the Office for National Statistics to get the data. They’d have to get to it and agree to it. That process is going to take six to nine months, even if I did it now and did it for free. All the different UK governments have different data stored in different secure locations, so you’d have to do it four times over, working with four different national governments. In theory, it’s dead easy to do. If I had the data, I could do it in two or three weeks. But it would take me so long to go and get the data – that is why it doesn’t end up getting done quickly. It’s the type of thing the governments could do themselves, and pretty quickly. Hey ho, the realities of life.
A busy man. You were going to go on and say something else. Was it about the test-date changes?
The test-date changes. The interesting thing is, back in 2000 and 2003, we were testing in the same period that we did this last time: February to May-ish. They ended up changing it in 2006 because they realised, “God, this is a terrible time to be testing our kids. They’re just going into Year 11. The last thing they need is another test on their plate.” The schools don’t want to do it, the kids don’t want to do it, particularly a test they don’t even find the results out about. No one finds out their PISA scores, because it’s impossible to. The date got changed, and my understanding is it got changed back this time because the OECD essentially said, “No, we want stuff to be happening earlier. You’ve got to do it.”
Part of the problem is we don’t know exactly what impact it has had, because it used to be Year 11s taking it around Christmas time. Now we’ve got Year 10s and Year 11s taking it at a different time of the year. It’s now different timing to the other parts of the UK. To be honest, we don’t have a good idea about the precise impact that has had. Ideally, what would’ve happened is they would’ve field-trialled this: some in the springtime, some in the winter, and seen if it had any impact on anything. I don’t think that happened, as far as I’m aware. I’ve had no evidence of that happening. I believe Ireland previously might have considered making a similar change to the time they were doing the assessment, but decided to back out of it because of what they saw when, I believe, they did try it in one field trial. It’s a big unknown. If you were to really push me on it, my hunch would be it wouldn’t have a huge impact on the averages. But that is probably a gut feeling, similar to Claude.
I wondered whether, among other things, that is one of the things that’s increased the number of exclusions, where you’ve got Year 11s who’ve got to April or May and they’ve given up. It’s not like the school’s not chasing them at all, but it gets harder and harder to do anything. But, as you say, what we really need is the implementation review rather than pure speculation.
Those exclusions can typically only happen for very specific reasons, like severe special educational needs, where they can’t access the assessment. Those kids would probably go down as non-respondents, which I think we just about hit the threshold of, rather than exclusions.
The exclusions were 7.6%, weren’t they?
It was very high. The reason why the OECD and all these international organisations limit it to 5% is because they think that introduces at most a five-point bias on the mean. If you’re at 5% exclusions, they think that could bias the average by five points. If we’re up to 7%, you could think, “Well, it’s credibly higher than five points.” It’s why these bias analyses are important, to understand the selection that goes on there as well. My hunches were similar to last time: we got about a 10-point upward bias, somewhere in that ballpark.
Last time we talked to you, you mentioned you were working on a particularly interesting way of looking at teacher value-added with Sam Sims and various others. How has that come on?
Good question. It’s progressing. We’re waiting for some more data. You’re never going to be able to do this well at the individual-teacher level, and that’s not what we’re trying to do. In fact, we’re recommending to people – everyone’s recommending – don’t even think about trying this stuff at the individual-teacher level. What this can probably give you is some idea about high-level national findings, in terms of characteristics of higher-value-added and lower-value-added teachers: how are they distributed across different groups, sets, and allocations? It’s just a challenging thing to do.
What you see in a lot of the US literature that has done this is it’s often in elementary schools, because you’ve got one teacher to a class of pupils, and you have high exposure to that teacher. A lot of the data that’s becoming available in England is more around secondary-school teachers and value-added there. But then you get into real big challenges, in terms of: “I’m taught by my maths teacher, but maybe my physics teacher influences my value-added.” There’s a really good motivation for thinking your form tutor could impact your value-added as well. How do you deal with all those more tricky issues, when your value-added in a subject like maths might not just be due to your maths teacher, but plausibly other teachers in the school as well? It’s a really challenging thing to do. We’ll see where it gets to.
Are you trying to control for all of those factors, or are you just aware that those factors might bias any estimates that you’re coming up with?
You want to do the former; you end up with the latter.
Fair enough. What else are you working on at the moment?
Topical, given the PISA results have come out: I’m finishing writing a textbook all around PISA methodology for my students at UCL. I’ve got an international comparisons course, a master’s-level course, where I talk all about PISA, PIRLS, TIMSS and international comparisons, and I came to the conclusion that having a good text resource out there would be really useful for them, but also for people who have these questions more generally when the PISA results come out – to have a relatively simple resource, hopefully, that they can turn to to understand more of these things. To be honest, like I was saying earlier, with AI now these things are much easier to produce. Obviously I don’t go out and go, “Write the text for me,” but I can go with my written text and go, “What mistakes have I made here? How could I improve this?” It’s been really useful for doing the polishing on that. Hopefully by the end of September or start of October, that’s going to be online.
I’ve got a role with The Engagement Platform TEP, doing really interesting stuff there in terms of pupil engagement and employee engagement as well: lots of interesting stuff looking at that data, and other stuff looking at long-term trends in international assessment outcomes, which is very topical again.
Reassuring that I’ve come to the person who’s literally written the book on PISA and everything else. John, lovely to catch up with you. Thank you very much.
Cheers, Harry.